The Architecture of Understanding: Core Systems Behind AI-Native Analytics
In this Part 3 of our “What it takes to make AI Native Analytics work in the real world” series (*) we are focusing on how the rise of LLMs changes the Data Analysts job and what we need to build to make AI work for analytics workflows.
Similarly to how access to Foundation Models fundamentally changed Software Engineering in the past year and made way for the Rise of the AI Engineer ( “https://www.latent.space/p/ai-engineer”), Data Analytics is changing and Data Analysts who successfully leverage LLMs capabilities will see their daily workflows transformed as routine tasks become automated while domain expertise and critical thinking become increasingly valuable.
But how does AI really change the Data Analysts day to day? And more importantly, what is missing to make LLMs help Data Analysts comparably to how they help Software Engineers? Because who wants to spend all this time and brain power on data transformation and basic exploratory analysis if they don’t have to? (not me…)
(*) Part 1 “What it takes to make AI NAtive Analytics work in the real world”
Part 2 “When Should You Fire Your Ai Assistant”
The Unique Challenges of Managing Analytics Projects
Analytics and AI projects face management challenges that are fundamentally different from software development. Unlike coding tasks with well-defined requirements, analytics projects often begin with ambiguous goals and evolve as insights emerge. This creates significant project management complexity where teams must navigate unclear success criteria across multiple stakeholders with competing priorities and varying technical understanding.
The inherent exploratory nature means building solutions before fully understanding the end result, requiring frequent iteration cycles and flexible planning.
- Data quality issues routinely derail timelines as teams discover problems only during implementation.
- Setting consistent conventions, metrics, and reusable components becomes critical yet difficult as each analysis may require unique approaches.
- Dependencies between data sources, models, and visualization layers create cascading effects when changes occur.
- The cost of changing direction increases dramatically as projects mature, yet the need for pivoting based on new findings is constant.
- Testing becomes extraordinarily complex when “correct” results aren’t clearly defined and data volumes make comprehensive validation impractical.
- Progress tracking is challenging when discovery-driven work doesn’t follow linear paths, making timeline control elusive.
Successfully managing analytics projects requires balancing structure with flexibility in ways that accommodate both technical exploration and business value delivery.
For instance, “revenue” rarely has a single definition across an organization—marketing might calculate it from campaign attribution, while sales tracks it from signed contracts, and finance recognizes it according to accounting standards. Each one of these corresponds to a different field in a specific data source. Without the business knowledge to determine which field is relevant in which data source, your analysis risks being irrelevant if not outright false.
These differing interpretations aren’t errors; they reflect legitimate business perspectives serving different purposes. For AI to deliver valuable analytics insights, it must understand these contextual nuances rather than searching for a single “correct” answer as it would when writing code.
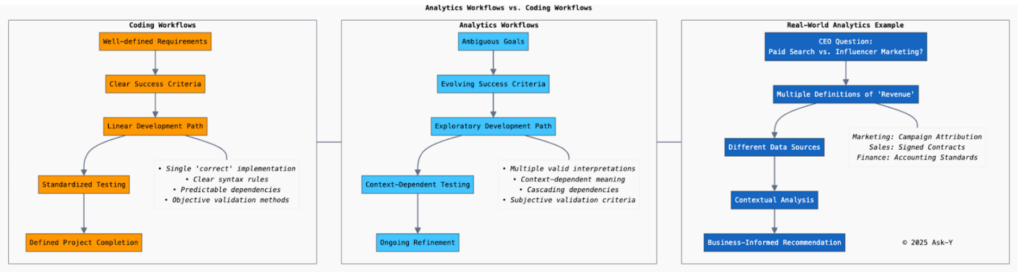
To illustrate the contrast between analytics and coding workflows, let’s examine a real-world analytics project: creating a predictive model to determine whether a company should invest more in Paid Search or shift budget to Influencer Marketing (identified as “referrals” in their tracking system). This project aims to answer the CEO’s direct question: “Should I put more money into Influencer marketing or should I continue investing in Paid Search?”
The fundamental difference between coding and analytics lies in their problem structure and definition.
While coding tools operate in environments with well-defined correctness criteria where code either compiles or fails, analytics platforms must navigate ambiguous success criteria where insights are evaluated based on business relevance rather than syntactical or analytical correctness.
In our example about answering the CEO’s question: “Should I put more money into Influencer marketing or should I continue investing in Paid Search?” we begin with an ambiguous business questions that require collaboration across multiple departments:
– The Marketing Team provides campaign context and historical performance data, eg: what are the data sources needed to answer this question?
Revenue and channel information can be tracked by many different platforms. For a medium sized organization, this can easily amount to 10 to 20 platforms: Google Analytics, Adobe, Shopify, Salesforce, Segment, …
Determining which one of these is the right source of truth for this question is a business decision as much as it is a technical constraint.
– The Analytics Team translates business questions into analytical approaches: determining which analytical methods to use to answer the question: what data points do we need? Do we need to access user based behavioral information to build a predictive model?
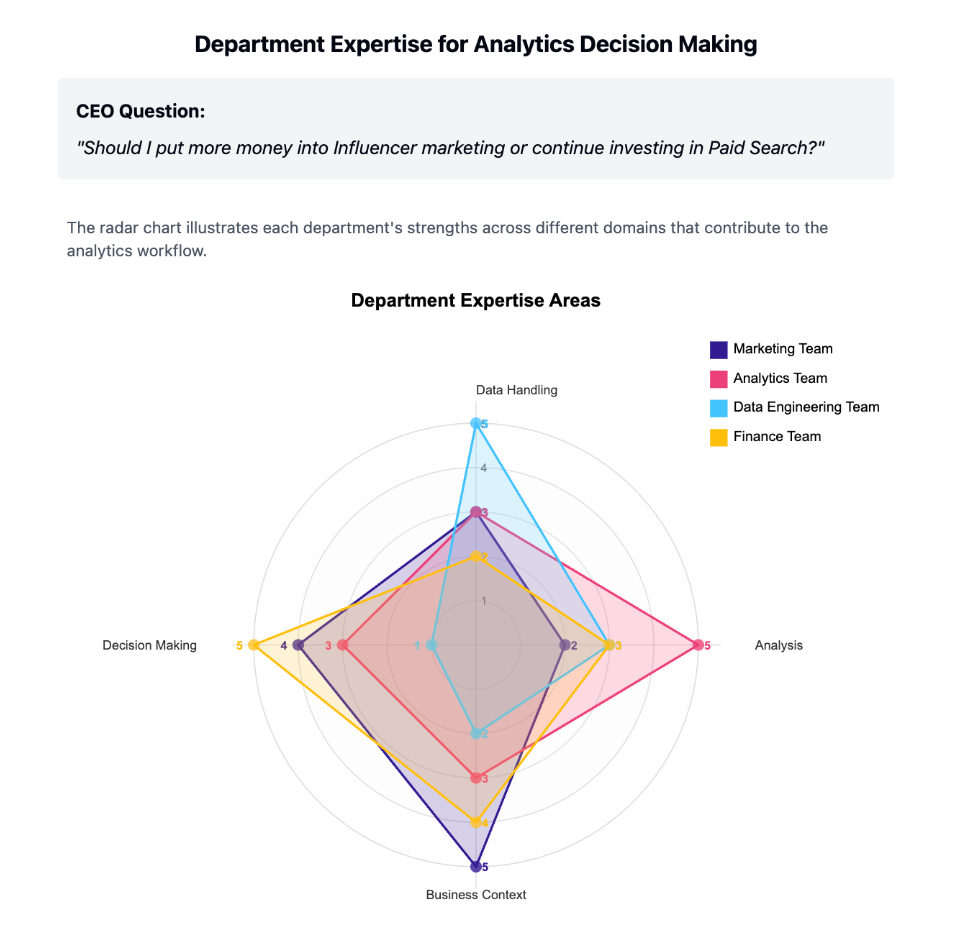
The choice of methodology is often driven by a mix of practical and analytical criteria, adding to the ambiguity of the analytical process.
– The Data Engineering Team ensures access to data sources at the right level of granularity, in this case because we want to build a decision tree we need access to user based information to compare purchasers and non purchasers, that means access to large tables containing granular data.
– The Finance Team contributes revenue recognition standards and ROI expectations. Ultimately, we need to fit the results of our analysis into the decision framework of whoever makes the final decision about marketing budgets (CEO, CFO, COO…). Typically, analysts don’t make business decisions, stakeholders do. The result of an analytics workflow in a typical business context ends up being presented by a non-analytics specialist to another non-analytics specialist. In our case we will make the Marketing Director present to the CEO.
Before any technical work begins, these teams must align on project goals, metrics definitions, analytics methods, success criteria and outputs.
Last but not least: success criteria and outputs is a whole universe in itself. Whereas for a software engineer, success criteria tend to be clearly defined in terms of story points, features built, etc, for an analyst the ultimate success criteria is fuzzy at best. Except for companies where analytics is the product, most analysts are not decision makers. In the immortal words of Jim Cain, one of the original co-hosts of The Analytics Power Hour podcast ( https://analyticshour.io/, I highly recommend it if you are not yet a listener), Analysts don’t make decisions, business people make decisions. In our example, that would mean a mix of Marketers and Finance execs. How to present an analysis for a Marketer or a Finance exec to make a decision is a very complex mix of art, science and experience.
So just for fun and to illustrate this point, here are a few ways to look at the differences in Coding and Analytics workflows:
Let’s try to communicate this point to our stakeholder:
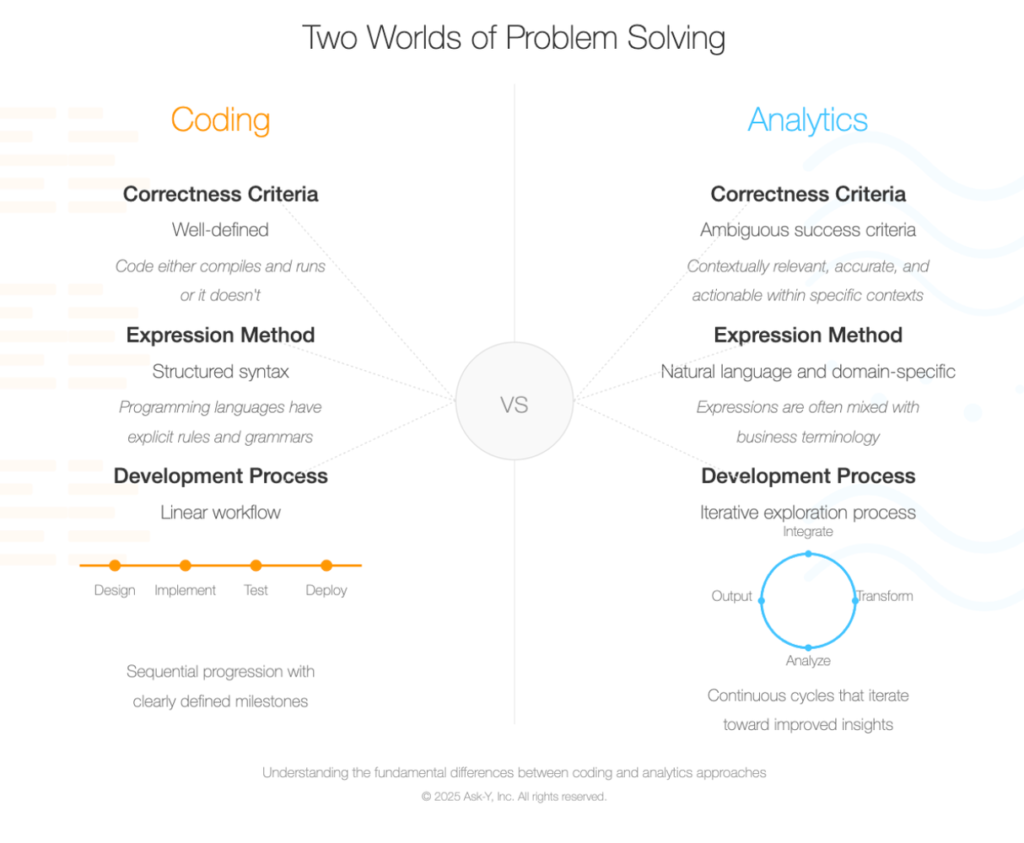
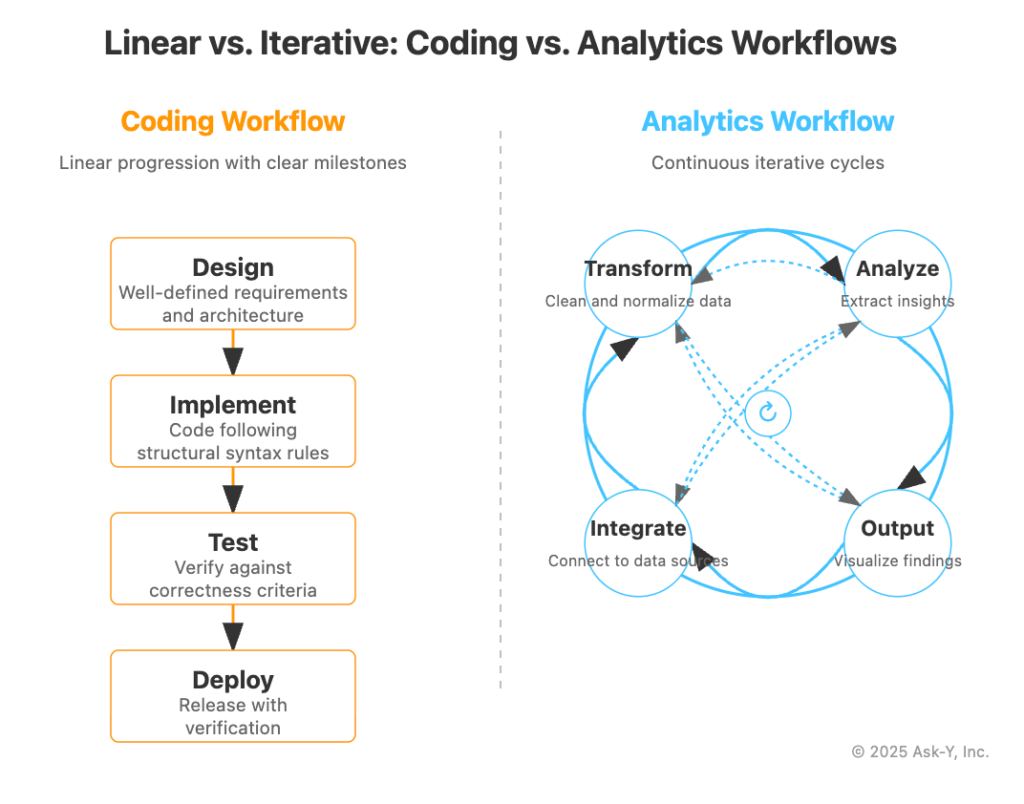
“This difference extends to Coding and Analytics fundamental workflows—code development typically follows a linear design-implement-test-deploy pattern with clear milestones, while analytics embraces an inherently iterative exploration process consisting of continuous cycles of questioning, hypothesis generation, testing, and refinement. “
For the sake of simplicity we will limit our data points to 4 steps in each process, so we have 2 categories: Coding and Analytics, with 4 data points each and we are conveying a fundamental difference between two processes that may seem similar on the surface but have fundamental differences at every level.
Here is a way to illustrate this that should get the gist of the message across regardless of whether your stakeholder is the reading type or not. The geometry of the illustration conveys the similarity and the difference at a glance and imprints a visual representation of both concepts in the viewer’s mind.
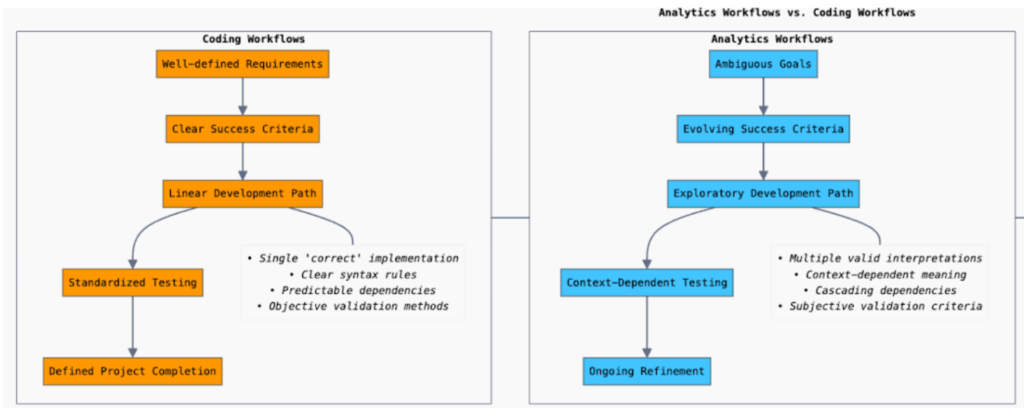
Maybe the previous visual didn’t work, so let’s try something else.
Sometimes you just need your stakeholder to be surprised by visuals they aren’t used to seeing so you capture their attention.
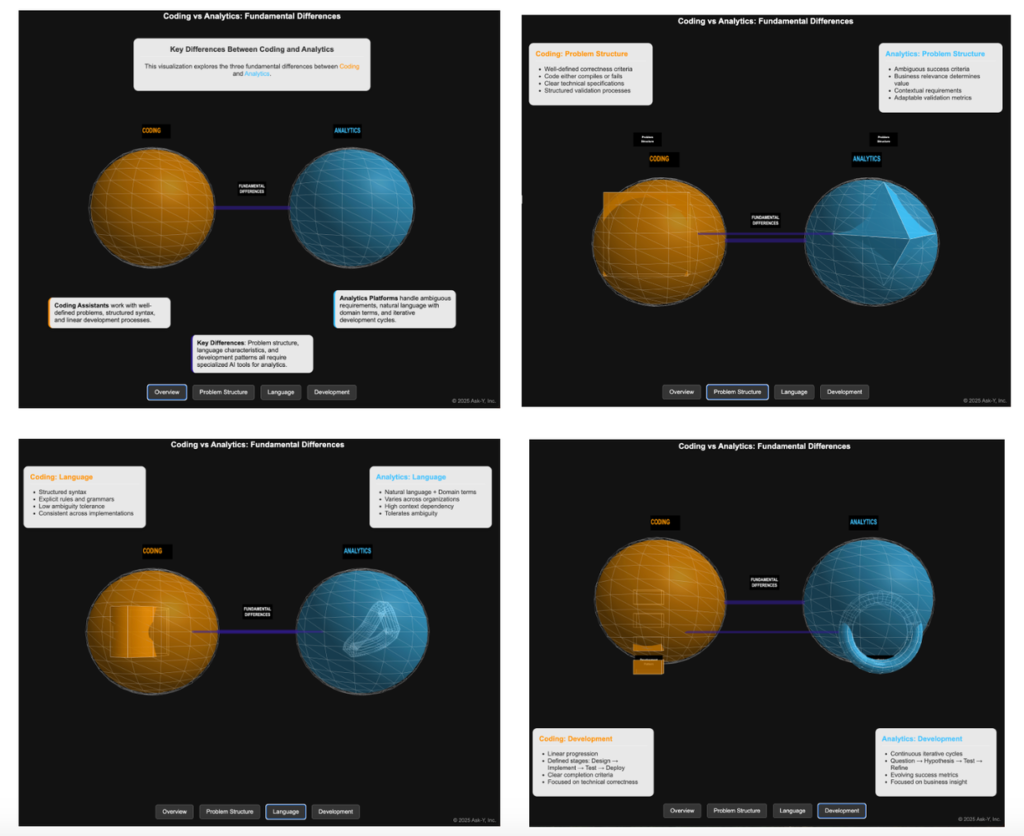
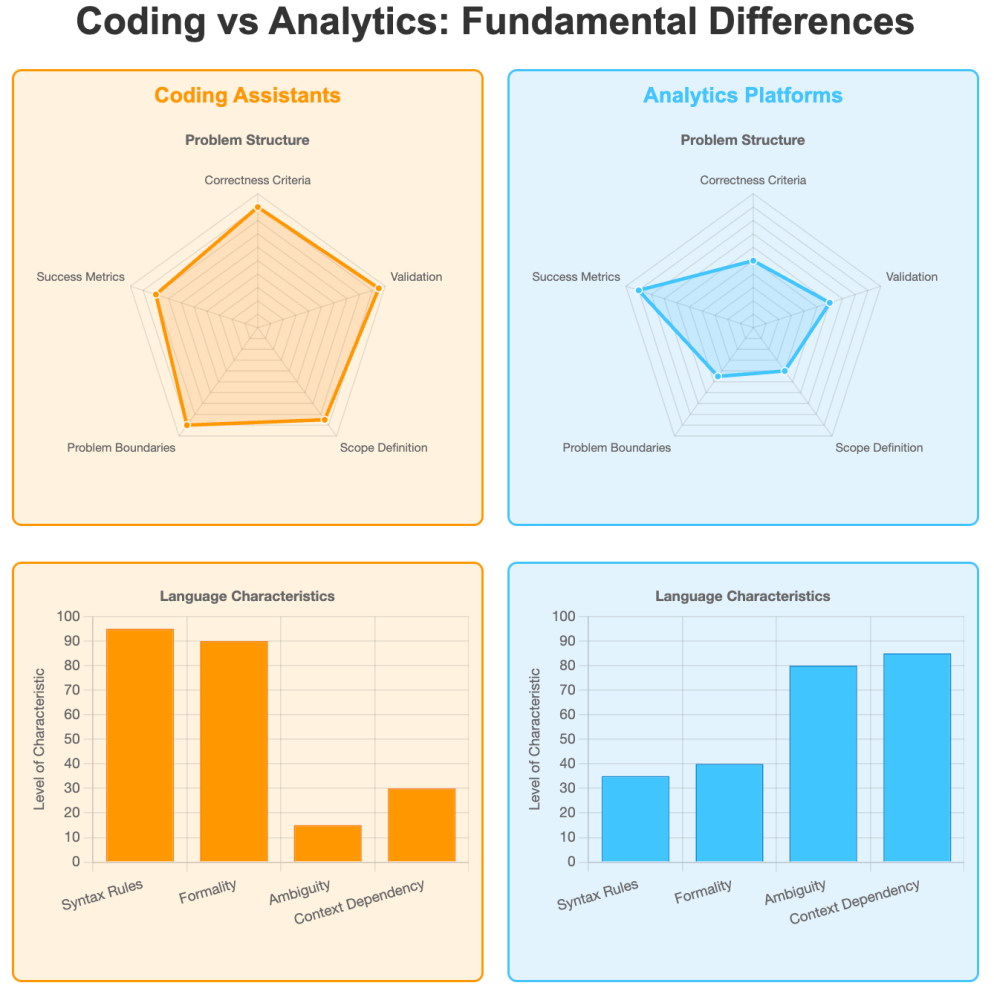
This may seem over engineered and obscure and maybe a bit pretentious (and it definitely is) but when you need to capture the attention of a high level executive and get a complex point across, the main barrier can simply be to get their attention off their phone and on your screen for a few seconds. Bar charts and Pie charts (even 3D exploded ones…) have a hard time achieving that, so you might need to get creative to hit your success criteria.
Or maybe your stakeholder reacts better to wordy but elegantly stylized lists with one simple visual cue.

Or sometimes, you just need to find a creative way to repeat the same point at least three times to make sure a key part of your rationale is understood and memorized by your audience.
Success criteria for analysts can be maddeningly particular, hinging on your ability to distill complicated findings into digestible insights on tight timelines. Your audience of decision-makers juggles countless priorities, rarely affording you the luxury of their undivided attention.
Knowledge And Context Management
Existing AI tools have been primarily optimized for code generation rather than data analysis workflows, creating significant gaps for analytics practitioners. These tools fail to address the fundamental knowledge representation challenge inherent in analytics, where meaning is deeply contextual and domain-specific.
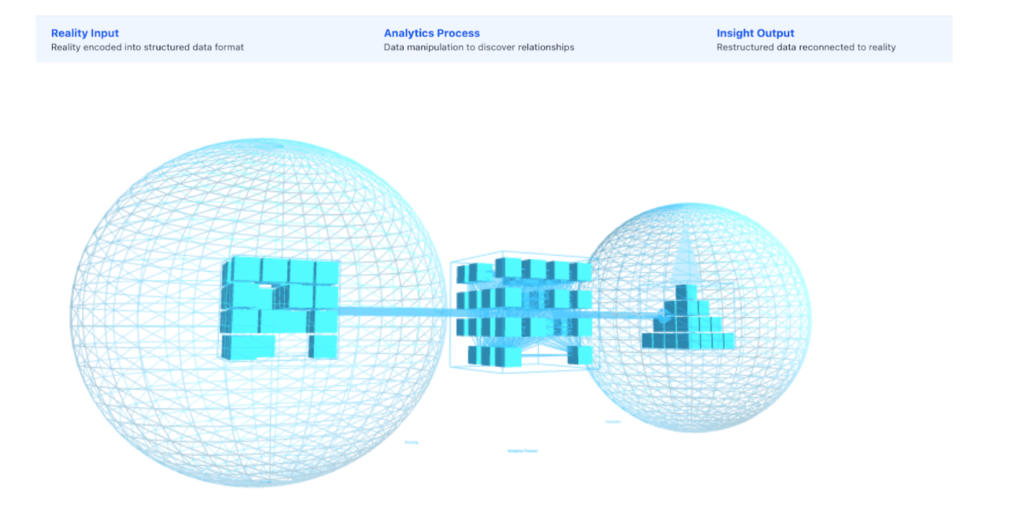
Data encapsulates representations of aspects of the real world. Bridging the gap between the real world and the compressed version of the real world represented in the data. This compression process inevitably results in information loss, with nuanced real-world phenomena being reduced to simplified data points and relationships. The analyst’s challenge lies in reconstructing this lost context, understanding what the data truly represents versus what it merely approximates.
During the initial encoding phase, critical decisions about what to measure and how to structure that measurement fundamentally shape how reality gets compressed into data, creating inherent limitations that persist throughout the analytics lifecycle.
The analysis process itself involves manipulating these abstract data representations through transformations, aggregations, and models that must somehow preserve the connection to the real-world phenomena they stand for, despite working with an already compressed and potentially distorted version of reality. At the output phase, analysts must then perform a second translation, converting their findings from manipulations of this compressed data representation back into meaningful statements about the actual business reality that stakeholders can act upon.
Business context and knowledge about how this context is represented in the data is typically distributed among several people in the organization and is never fully documented anywhere in a way that is practically usable in an analytics project. This tribal knowledge becomes a critical factor that AI systems must somehow capture and represent.
In our marketing channel investment example, a typical exchange might unfold like this:
Data Analyst: “Which field should I use for revenue in this analysis?”
Marketing Operations Manager: “In GA4 it’s ‘Revenue in USD’ but not the ecommerce field—we implemented it as a custom event. Also, we had a tagging problem in July and the values are doubled for that time period. Oh, and we also had issues passing channel variables in September, so we have to clean those manually.”
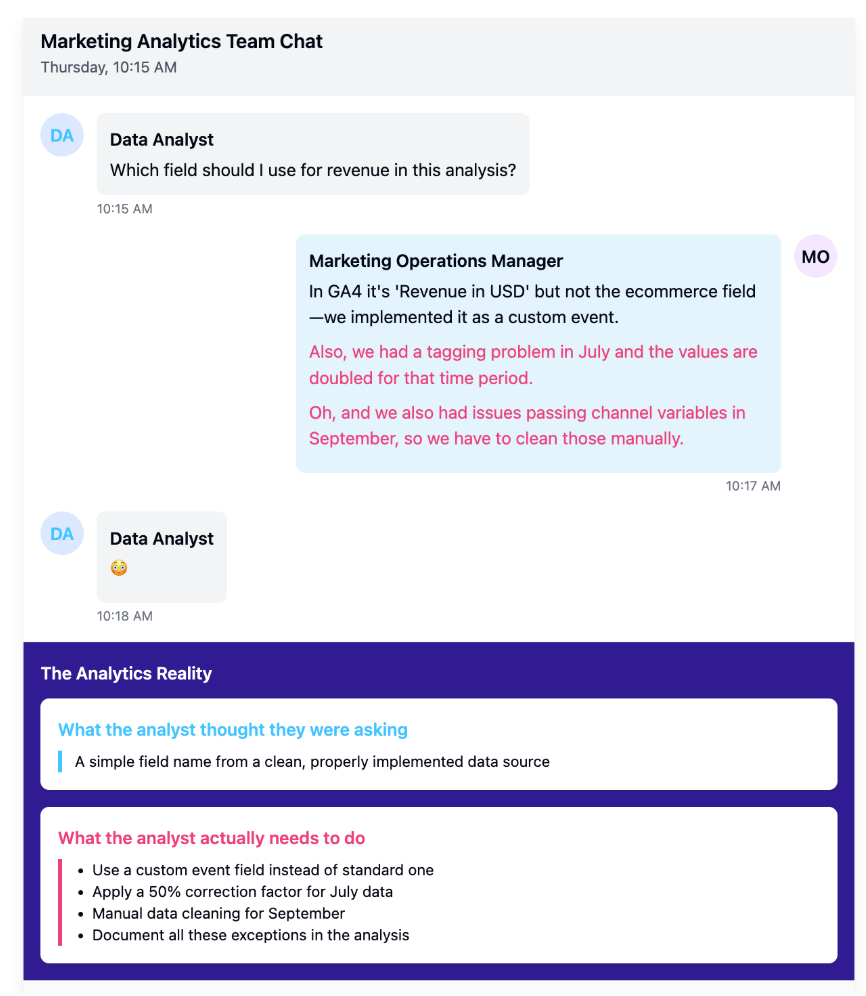
This casual exchange contains critical information about data quality, field selection, and necessary transformations that would never appear in formal documentation but is essential for accurate analysis. Without this knowledge, even the most sophisticated algorithm would produce misleading results.
A practically functional AI-native analytics platform needs systems that can track context and keep it available during the project execution when it is relevant to the analytics process at hand. This also means having domain-specific reasoning capabilities that can navigate complex business logic and varying interpretations of metrics across organizations.
Additionally, these systems must solve data connectivity and context preservation requirements—maintaining relationships between datasets, analyses, and business objectives that may span multiple tools and stakeholders. The ultimate goal is developing AI that understands analytical intent behind queries, not just syntax, enabling it to reason about business problems rather than simply executing predefined operations on data.

Structural Organization
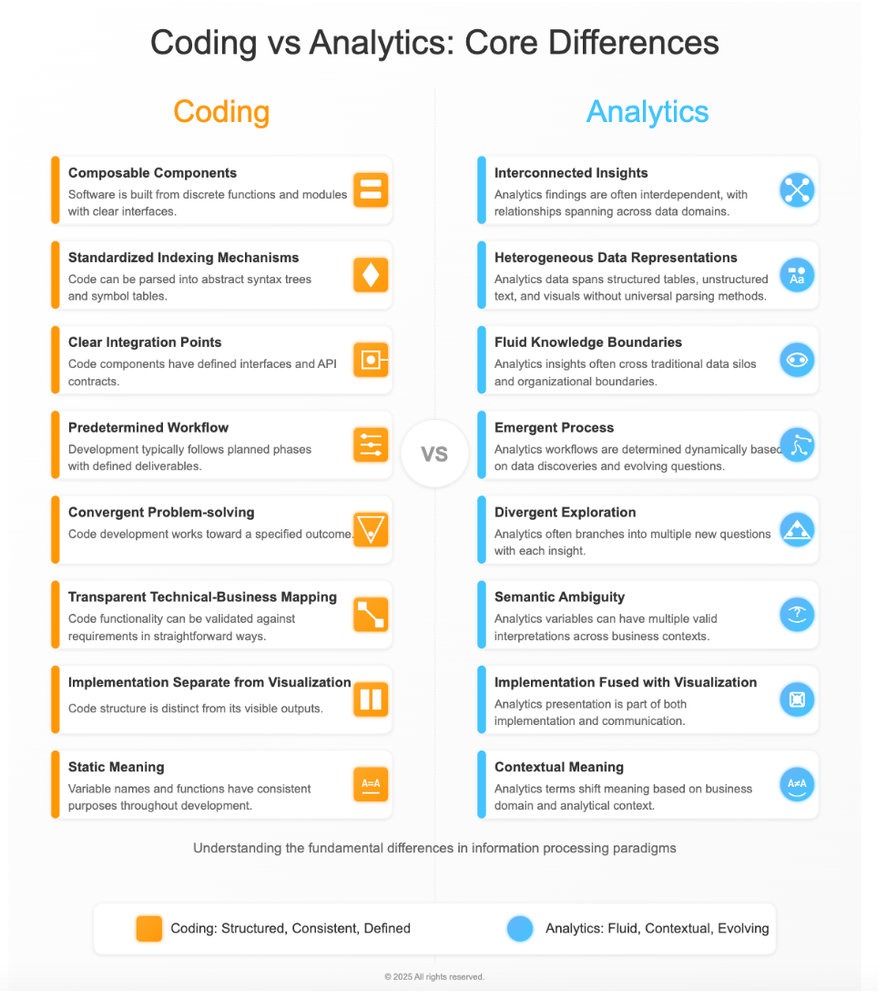
The structural organization of code versus analytics environments reveals why AI assistance approaches must differ substantially between domains. In software development, code assistants benefit from working with composable components—discrete functions and modules with clear interfaces that can be assembled in predictable ways.
A critical distinction is that analytics workflows are fundamentally iterative in nature. While software development projects can often be planned in advance with clear milestones, analytics paths are determined dynamically based on data quality and emerging insights.
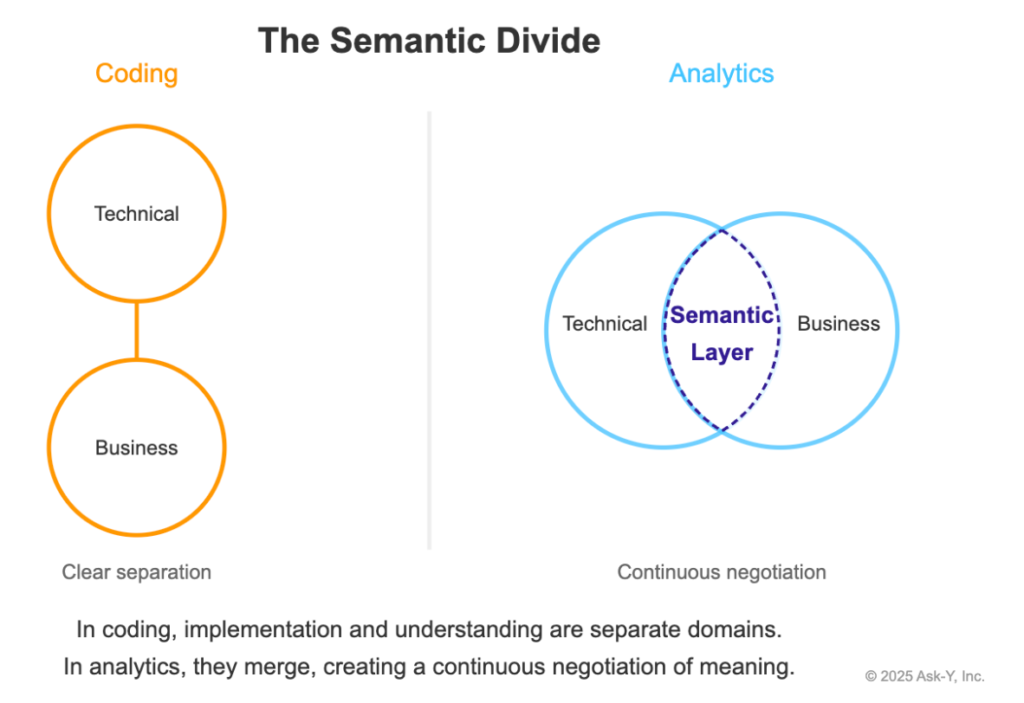
Beyond these workflow differences lies a deeper semantic challenge: analytics code creates a significant divide between technical implementation and business understanding. Unlike programming where outputs are distinct from code, analytics merges implementation and interpretation into a single continuum where meaning is constantly negotiated between technical and business domains.
In our marketing channel investment example, this iterative nature becomes evident when the analyst first examines the “Medium” field data:
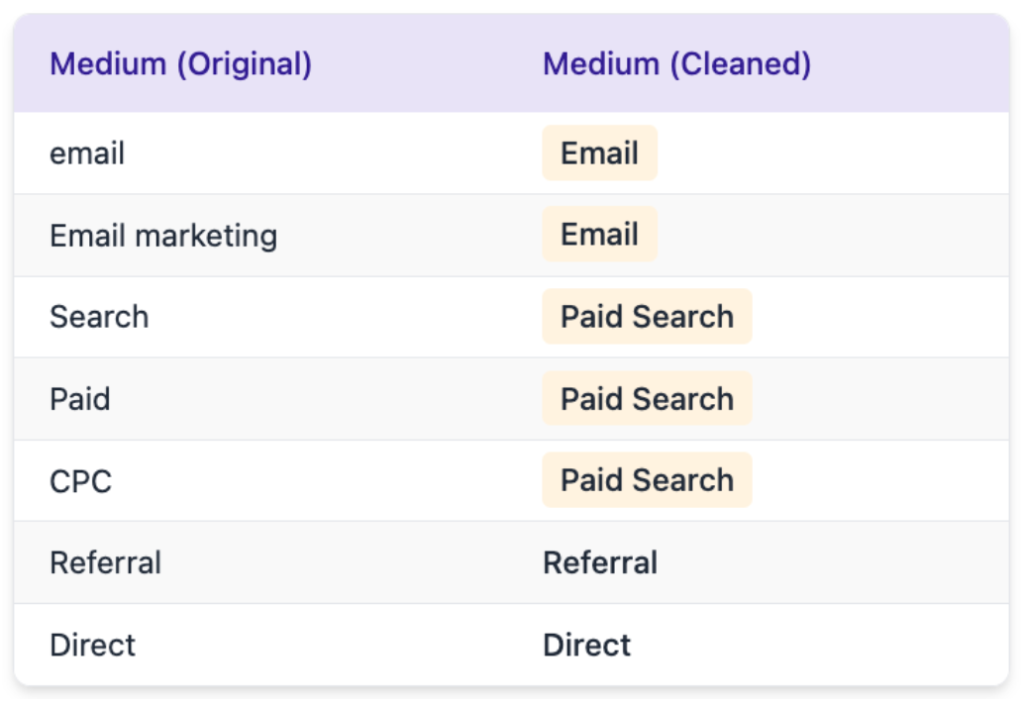
Upon discovering this inconsistency (where “email,” “Email,” and “EMAIL” all represent the same channel), the analyst must make real-time decisions about data cleaning approaches. Similarly, if they find 30% of records have null values for a critical period, they must decide whether to impute values, exclude the period, or adjust the analysis scope—decisions that can’t be pre-programmed.
This example illustrates the interpretative barriers inherent in analytics: the code that transforms “email,” “Email,” and “EMAIL” into a standardized value encodes business decisions about equivalence that remain hidden in technical implementation. Without a transparent semantic layer connecting implementation to meaning, business stakeholders struggle to evaluate whether the analysis truly answers their questions.
The other major reason analytics workflows are iterative is that each answer typically generates multiple new questions. Unlike code that builds toward a specified feature, analytics builds toward deeper understanding through successive rounds of inquiry. In our example, after discovering that Paid Search has strong predictive power for revenue, the natural next questions might include:
– “Is the Paid Search impact consistent across all countries, or only in specific regions?” – “Does Paid Search perform equally well on mobile and desktop devices?” – “Is the effect stable across seasons, or does it show temporal variation?”
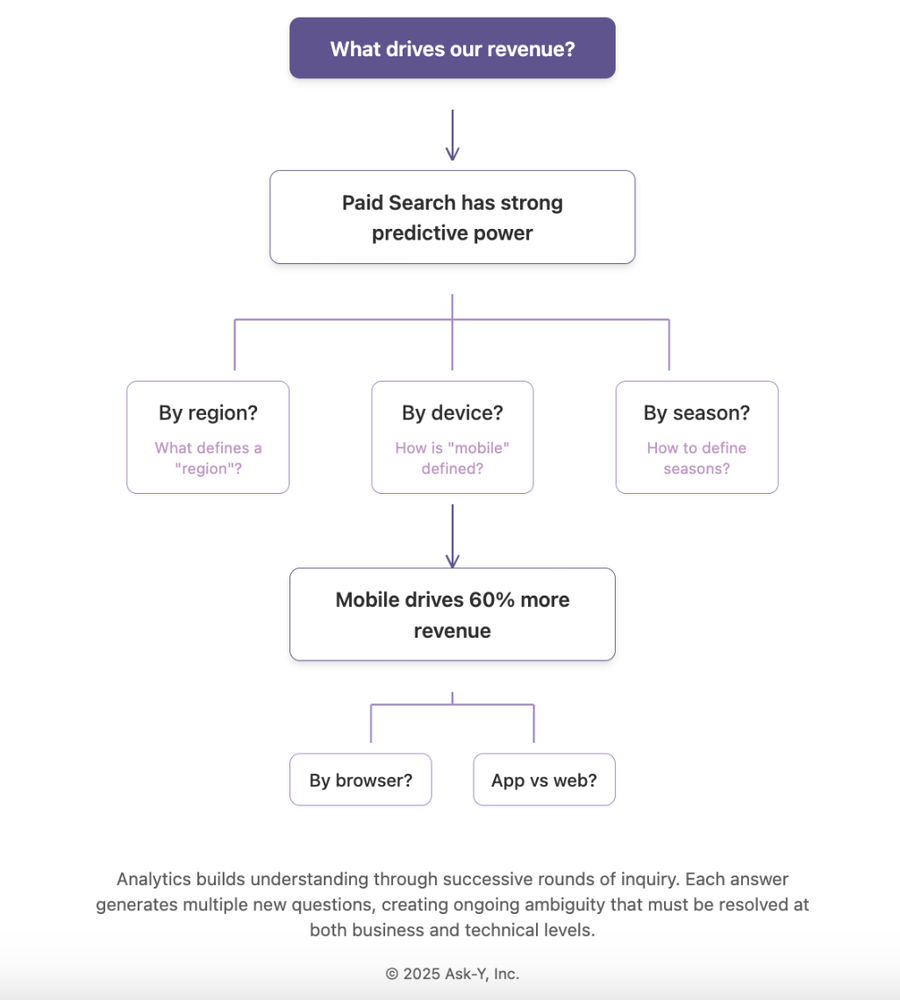
Each of these questions introduces ambiguity that must be resolved at both semantic and technical levels. What exactly constitutes a “region”? How is “mobile” traffic differentiated from “desktop”? The mapping between business concepts and their technical implementations creates a complex web of interpretations that must be documented and accessible to maintain analytical integrity.
Each of these questions requires its own data validation, cleaning, and modeling approach. The analyst doesn’t follow a linear path but navigates a decision tree of possible investigations based on:
1. Data availability and quality for each new dimension (Do we have reliable device type data?)
2. Business priorities (Is understanding regional variation more important than device differences?)
3. Analyst capabilities (Do we have the statistical expertise to handle temporal analysis?)
This decision-making process embeds critical business context that remains invisible in the final analytical code. A comprehensive solution requires bidirectional translation capabilities that allow business users to understand technical implementations and modify analyses through natural language, while maintaining the precise semantic mappings between business variables and their technical implementations.
Analytics insights are inherently interconnected, with findings that span across data domains, business units, and analytical methods, creating complex webs of relationships rather than linear dependencies. Code’s standardized indexing mechanisms allow it to be parsed into abstract syntax trees and symbol tables that AI systems can navigate efficiently, while analytics data exists in heterogeneous representations spanning structured tables, unstructured text, dashboards, and presentations without universal parsing methods.
Unlike code where visualization is separate from implementation, in analytics the visualization itself is both implementation and communication medium. This dual role creates unique structural challenges in maintaining the connection between visual elements, underlying calculations, and business meaning that are not present in traditional coding environments.
Where code provides clear integration points with defined APIs and contracts that establish boundaries between components, analytics insights frequently cross traditional data silos and organizational boundaries, requiring AI systems that can maintain context across these fluid knowledge domains. These structural differences demand fundamentally different approaches to how AI tools organize, access, and reason about information in each domain.
Feedback And Validation
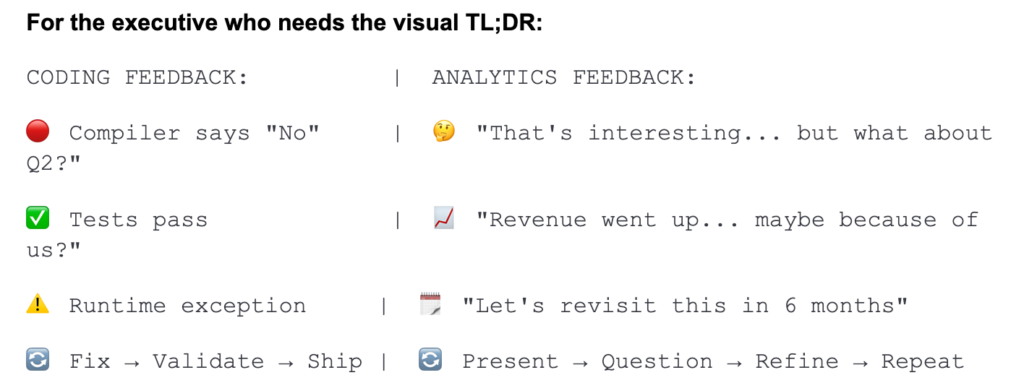
The feedback and validation mechanisms in coding versus analytics represent perhaps their starkest contrast when considering AI assistance requirements. Code assistants operate in environments with direct, immediate feedback loops—compilation errors, failed tests, and runtime exceptions provide unambiguous signals when something is wrong, allowing for rapid iteration and correction.
Analytics insights, however, face delayed and subjective validation cycles where the value of an analysis may only become apparent weeks or months later through business outcomes, with success metrics that vary by stakeholder and organizational context.
Where coding tools can verify correctness through automated processes with deterministic outcomes, analytics work requires human judgment to evaluate relevance, actionability, and alignment with business objectives.
Since our stakeholders have varying attention spans and communication preferences, let’s consider multiple ways to convey our feedback and validation insights:
For the detail-oriented stakeholder who appreciates elegant lists:
Three Ways Analytics Validation Differs From Coding Validation:
- Time Dimension
- Success Definition
- Validation Authority
For the stakeholder who only remembers what you tell them three times:
Analytics validation isn’t like code validation. Analytics validation happens in human minds, not computer systems. Analytics validation occurs over business cycles, not build cycles. (Did we mention that analytics validation isn’t like code validation?)
For the 3D-visualization enthusiast:
“Imagine we created an interactive visualization showing coding validation as a straight highway with clear traffic lights, while analytics validation appears as a winding mountain path with scenic viewpoints and occasional fog. The geometry would convey both the precision of coding validation and the meandering yet potentially rewarding journey of analytics validation. We’d incorporate tooltip hovers detailing specific validation challenges like ‘The CFO Who Changed His Mind’ or ‘The Mid-Quarter Market Disruption That Invalidated Everything.'”
For ultimately getting your point across:
Analytics teams need fundamentally different validation frameworks than development teams because:
- Analytics insights create value through human decisions, not machine execution
- True validation often comes after business implementation, not before
- Success metrics evolve as business understanding deepens
- Each stakeholder applies different validation criteria simultaneously
- Analytics validation requires managing both technical correctness AND business relevance
That’s why AI-native analytics platforms need specialized validation approaches that:
- Capture and document expert validation feedback
- Maintain alternative interpretations until conclusively resolved
- Connect insights to downstream business outcomes
- Adapt validation standards to organizational context
- Support progressive refinement through stakeholder dialogue
This fundamental difference in feedback mechanisms explains why AI Native platforms for Analytics must be designed to reason about business impact and stakeholder needs rather than simply optimizing for technical correctness, incorporating uncertainty into their recommendations in ways that coding assistants rarely need to consider.
Transforming the Analyst’s Role
We are witnessing a fundamental transformation in how analytics is performed, driven by the emergent capabilities of Large Language Models (LLMs). Just as foundation models have revolutionized software engineering, they are now transforming the analytics profession by automating routine tasks and enhancing the capabilities of those who work with data.
Just as software engineers’ value wasn’t in writing code but in systems thinking and integration, data professionals’ core value lies in their domain knowledge, data, numbers and business intuitions, and judgment—not in implementing data connections, statistical methods or writing queries.
Transforming the Analytics Workflow
The analytics workflow is being transformed by AI at every stage, allowing analysts to focus on higher-value activities. Traditional analysts often spend 80% of their time on tedious data preparation and basic exploratory analysis, leaving precious little time for meaningful insights. AI is changing this equation dramatically.
Here’s how AI is reshaping specific parts of the analyst’s workflow:
- Data Transformation: Faster/Automated cleaning and normalization of messy data
- Exploratory Analysis: AI-powered pattern detection and anomaly identification
- Model Building: Simplified creation and testing of predictive models
- Insight Generation: Faster/more flexible discovery
- Communication: Better/faster visualization and narrative generation for stakeholders
Analysts who effectively leverage these AI capabilities will see their productivity multiply while delivering deeper insights that drive better business decisions.
What is needed to really make AI work for Data Analysts in the real world
Managing Memory, Context, Disambiguation and Workflow challenges
At the core of Ask-Y’s AI-native analytics platform lies a sophisticated architecture designed specifically for the unique challenges of analytical reasoning.
The Architecture of Understanding: Core Systems Behind AI-Native Analytics
We built several specialized components working in concert:
- JAM (Joint Associative Memory) serves as our context-aware memory engine, preserving the rich relationships between data, metrics, and business concepts across organizational boundaries.
- MINGUS (Modeling Intent in Natural Language into Granular, Unambiguous Scripts), interpretative descriptive language that builds a semantic layer between natural language and code
- RiffML, an agent coordination framework that manages the complex, iterative nature of analytics exploration.
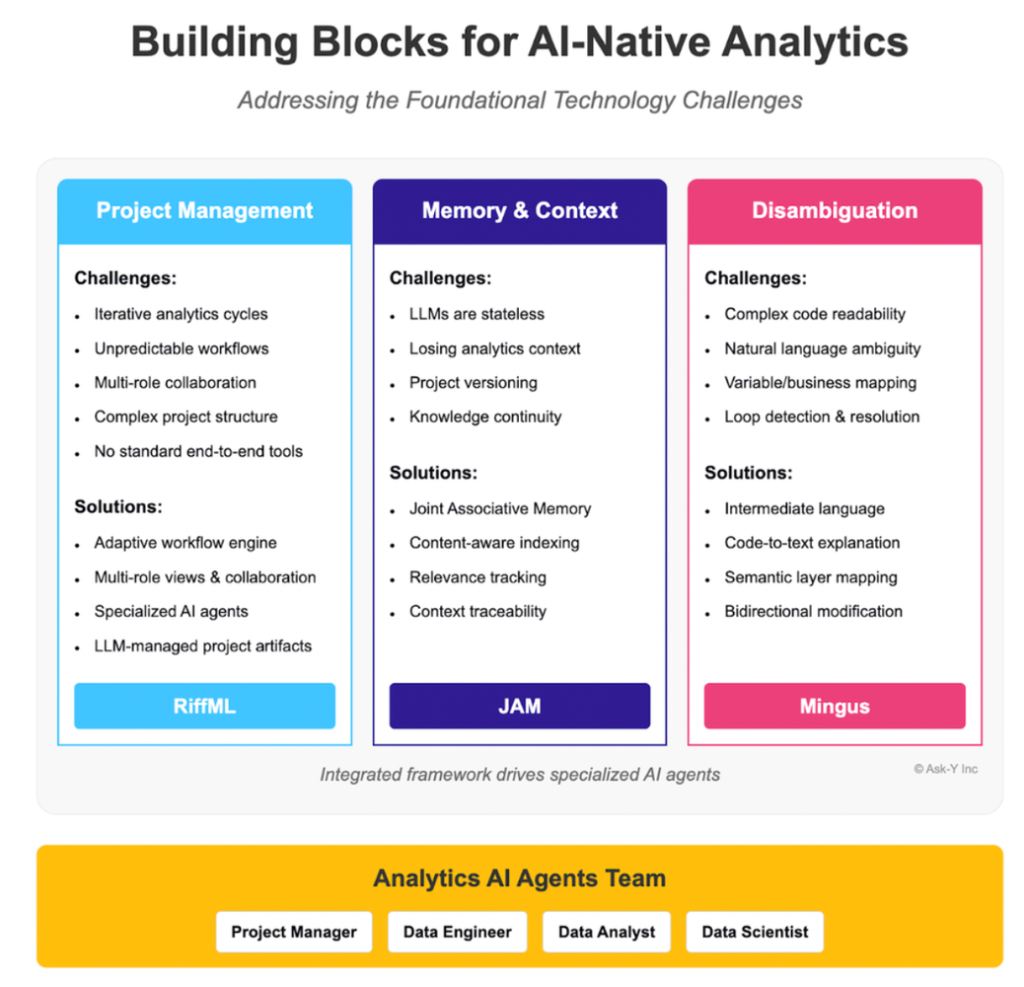
Underpinning these systems is our custom LLM architecture, fine-tuned specifically on analytical reasoning patterns to recognize business context, maintain multiple parallel interpretations of data, and generate insights that align with organizational knowledge. Together, these components form a cognitive system that thinks like an analyst rather than simply executing predefined queries.
We live this AI Native transformation at every level of our organization, far beyond the engineering team and permeating every aspect of our company culture. Everyone, regardless of role, actively engages with AI tools daily and maintains side projects that involve AI coding assistants. This “all-hands-on AI” philosophy creates a unique feedback loop where our entire team—from engineers to non-technical roles—gains firsthand experience with the capabilities and limitations of these tools.
We’ve fundamentally restructured our knowledge management to be AI-readable, developed “LLMing” practices to overcome tool limitations, and built custom recipes that optimize our workflows. This immersive approach has transformed our communication patterns, documentation quality, and collective standards while providing invaluable empathy for our users’ experiences (more details here).
By embedding ourselves in the AI ecosystem we’re building for, we ensure our product decisions are informed by diverse perspectives and real-world usage patterns. Our technology isn’t just what we create—it’s how we operate, giving us unique insights into building truly intuitive, context-aware analytics tools that think like human analysts.
Thank you for reading, all images powered by AI:)
Link to the article on LinkedIn.